So you have Splunk and F5 but are thoroughly confused about which F5 App to use because Splunkbase has eight!
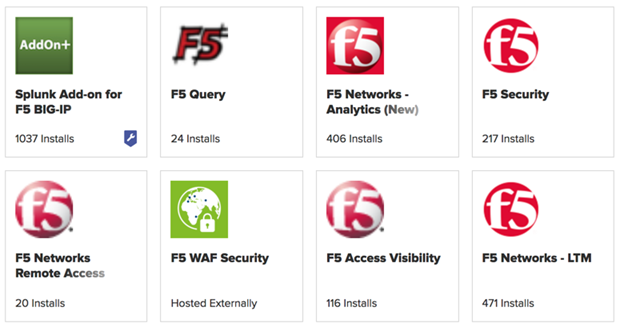
It’s simpler than it seems, so let’s do a rundown of what each F5 App does.
This App provides a custom Splunk command that allows you to query the status of F5 vServers and Pools. While very cool, it only provides the capability to write your own limited set of F5 dashboards.
This open-source App provides dashboards specific to the F5 WAF (Web Application Firewall). If that is all you need to monitor, then getting this App up and running is very straightforward.
These Apps have been around for quite a while (pre-Splunk 6.x) and while they still work, they suffer from two major issues:
- They get all of their data via syslog – which means you are missing the majority of the data that your F5’s can produce.
- Many of their dashboards use Advanced XML, which has been deprecated for years. Sure, it still works even in Splunk 7.0 – but if you want to customize them, you’re on your own.
This is the latest Splunk supported method for ingesting F5 data. It has many advantages over all the other Apps:
- Via REST calls, it can gather much more data than is possible via syslog.
- It also gathers and processes all the syslog data that the other Apps do.
- It maps the majority of its data to the Splunk Common Information Model, which means it supports SplunkEnterprise Security OOB.
- This Add-On is required if you want to leverage the ITSI Load Balancer module.
That being said, it has several disadvantages:
- It does not scale well because it gathers its data via REST. I’m not saying that REST does not scale, just that the Splunk/F5 REST does not scale much beyond a small-ish number of F5’s per HF (it also depends on how much each F5 is “doing”).
- It has a limited number of dashboard panels, which means it requires you to develop dashboards (or purchase ITSI).
F5 Analytics is the App you should be running because it has very comprehensive coverage of the F5 (full disclosure: I worked on this App):
- It covers the majority of F5 subsystems – Device Groups, Devices, Application Pools, Tenants, Security, Clients, DNS, etc. Just one tab of one dashboard contains a comprehensive URL analysis system!
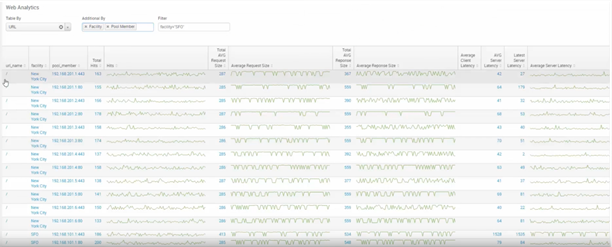
Figure 1 – Web Analytics Example
- It makes extensive use of drill-downs, allowing you to begin at a high-level and then drill into data that requires investigation.
- All data is collected in a “push” manner from F5 to Splunk. You install an iApp, configure it, and then data is forwarded to Splunk via HTTP Event Collector (HEC). Note that Syslog and SNMP traps are also sent via HEC (if so desired).
- The implementation is extensively documented and covers all versions of BigIP from 10.x – 12.x.
- It has a comprehensive built-in KPI system that covers both device-level KPI’s (e.g., CPU, memory, disk) and application-level KPI’s (e.g., pool members, server latency). Think of it as “ITSI-lite”!
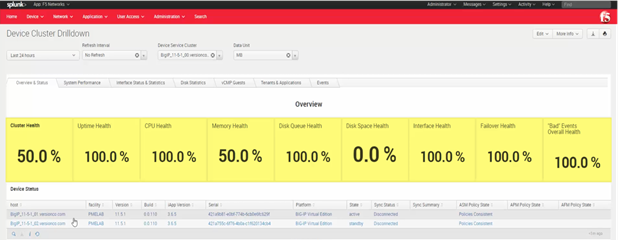
Figure 2 – Device KPIs Example
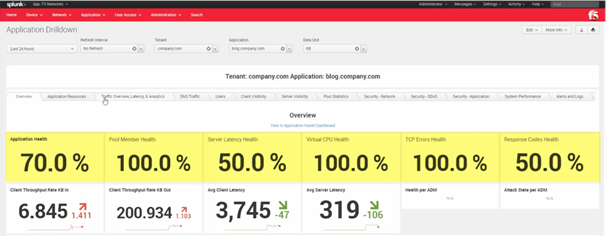
Figure 3 – Application KPIs Example
- It makes extensive use of outlier detection to allow you to spot out-of-normal behavior quickly – both visually (see below) and via the KPI system:
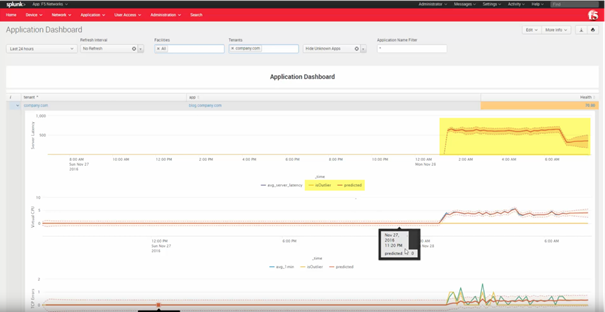
Figure 4 – Visual Outlier Example
Two caveats to note:
- The 1.0 version of this App is not CIM compatible so the data will not show up in Enterprise Security.
- Similarly, it does not support the ITSI Load Balancer module.
Conclusion
If you have both Splunk and F5, then you should check out the F5 Networks – Analytics (new) App, even if you are an ES and/or ITSI shop.
Want more insight like this? Make sure to follow us on LinkedIn, Twitter and Facebook!
