Day 1: You’ve just finished migrating applications to the cloud and breathe a sigh of relief.
Day 2: You turn on the service and everything works. Whew!
Day 3: You get the first invoice and about fall out of your chair.
There's a false rumor going around that monitoring and managing cloud spend is a full-time job. Application and technology owners hear horror stories of AWS invoices far exceeding what they expected. The problem isn't astronomical AWS prices or hidden costs -- No, the real problem is a lack of budgeting policies & proper visibility. Based on my experience migrating large enterprise customers from data-centers to the cloud, I've developed a few techniques to solve this business challenge:
- Monitor AWS spend in real-time
- See a consolidated view of all services, accounts
and regions - Slice-and-dice the data quickly to find insights
- Setup alerts to be notified when deviations happen
- Forecast future costs so you can plan for the future
The key to solving this critical business challenge is simple if you know how to
So what is Splunk App for AWS?
The Splunk App for AWS gives you critical insights into your Amazon Web Services account. It comes loaded with dashboards, reports, and alerts that deliver real-time visibility into your environment. Getting data from AWS into Splunk is easy if you follow these simple step-by-step instructions.
Where can I get it?
You'll need to head over to Splunkbase.com and download these two apps:
What dashboards come out of the box?
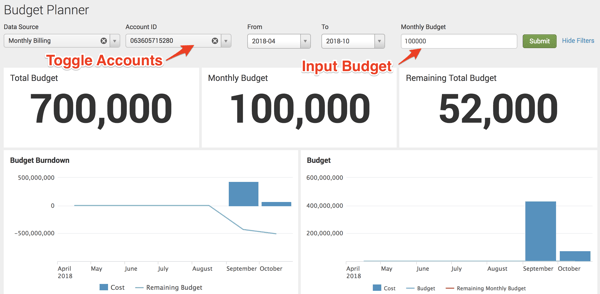
1) Budget Planner - Allows you to input your monthly budgets to track current spend. Using the forms at the top, link each account to an estimated monthly budget. This setting will update each panel so you can visualize how close you are to maxing out.
2) Current Month Estimated Billing - This dashboard gives you up-to-the-minute costs for the current month. Different panels break down the spend by both AWS accounts and services. The month-over-month gives context by comparing this month's spend to last month.

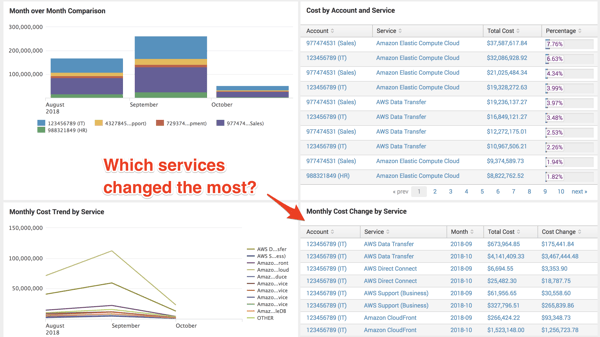
3) Historical Monthly Bills - This dashboard allows you to compare all services at a high-level, showing totals across each month. Make sure to keep an eye on the "Monthly Cost Change" panel. This one will monitor how much a service changed from one month to the next -- indicating areas to optimize and focus on.
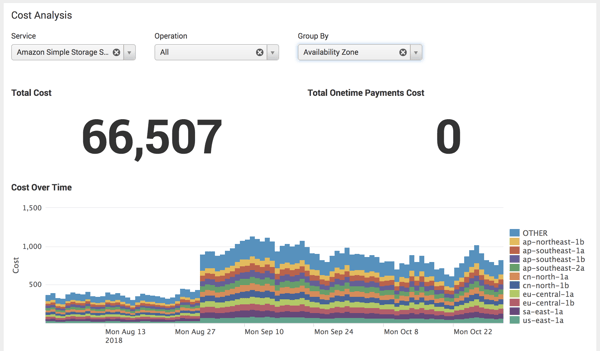
4) Historical Detailed Bills - This is my favorite dashboard that shows which AWS service is costing me the most money. Using the "Cost Analysis" I'm able to drill down into a single service, narrow down on operations (optional), and group by availability zone, region, account...etc. These inputs are very interactive -- allowing you to quickly play with the data to see what operations INSIDE a service cost you the most money.
Feedback and Questions
We're eager to hear your thoughts on Splunk App for AWS, so please feel free to reach out with any feedback or questions you have.
Want more insight like this? Make sure to follow us on LinkedIn, Twitter and Facebook!