If you administer Splunk Enterprise Security then you have probably noticed a couple of issues about managing content:
- ES’s Content Manager isn’t very zippy.
- Getting an overview of your ES Content is difficult.
I wrote the ES Configuration Explorer App to solve these issues for my own use, as someone who delivers Enterprise Security Professional Services, so I thought I’d share it with everyone!
This App provides an easy and fast way to get information on your ES-specific configuration items. For example:
- Which Correlation Searches are enabled, are real-time, or use Extreme Search?
- How many and which Key Indicators are accelerated?
- Which Correlation Searches set risk scores and by how much?
- Who might have been editing Correlation Searches?
- … and much more.
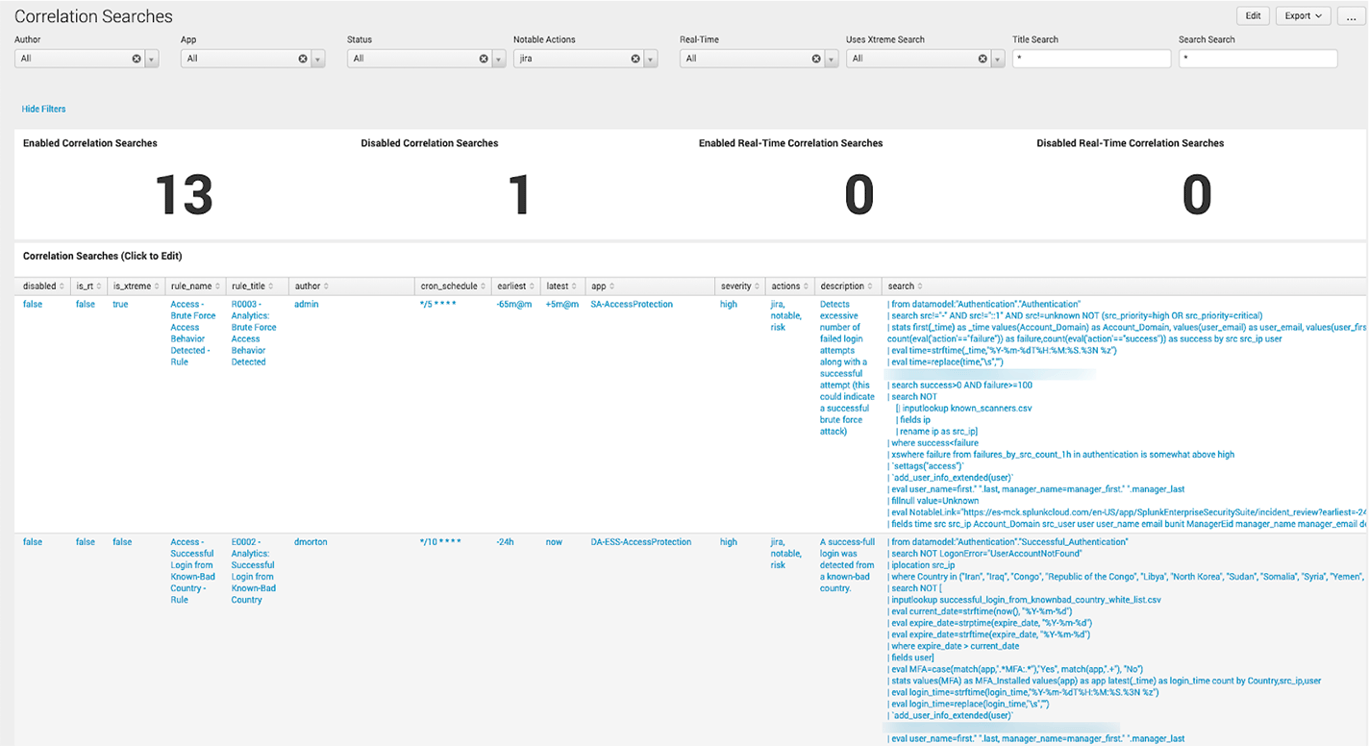
Below is the Correlation Search dashboard. It shows you all the details right up front. It also lets you quickly filter on several vital aspects like App and real-time status. Clicking on a Correlation Search takes you directly into the Correlation Search Editor!
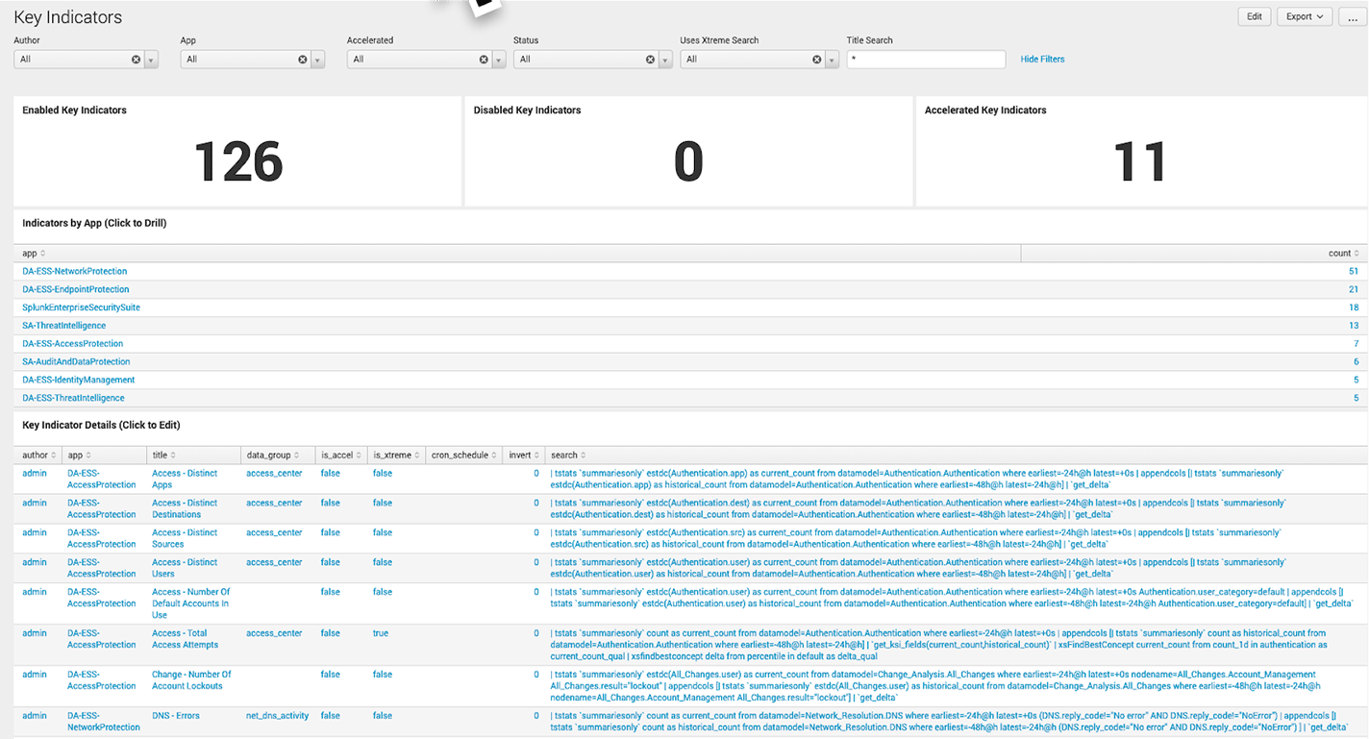
Below is the Key Indicator dashboard. As with the Correlation Search dashboard, clicking on a KPI takes you into the editor.
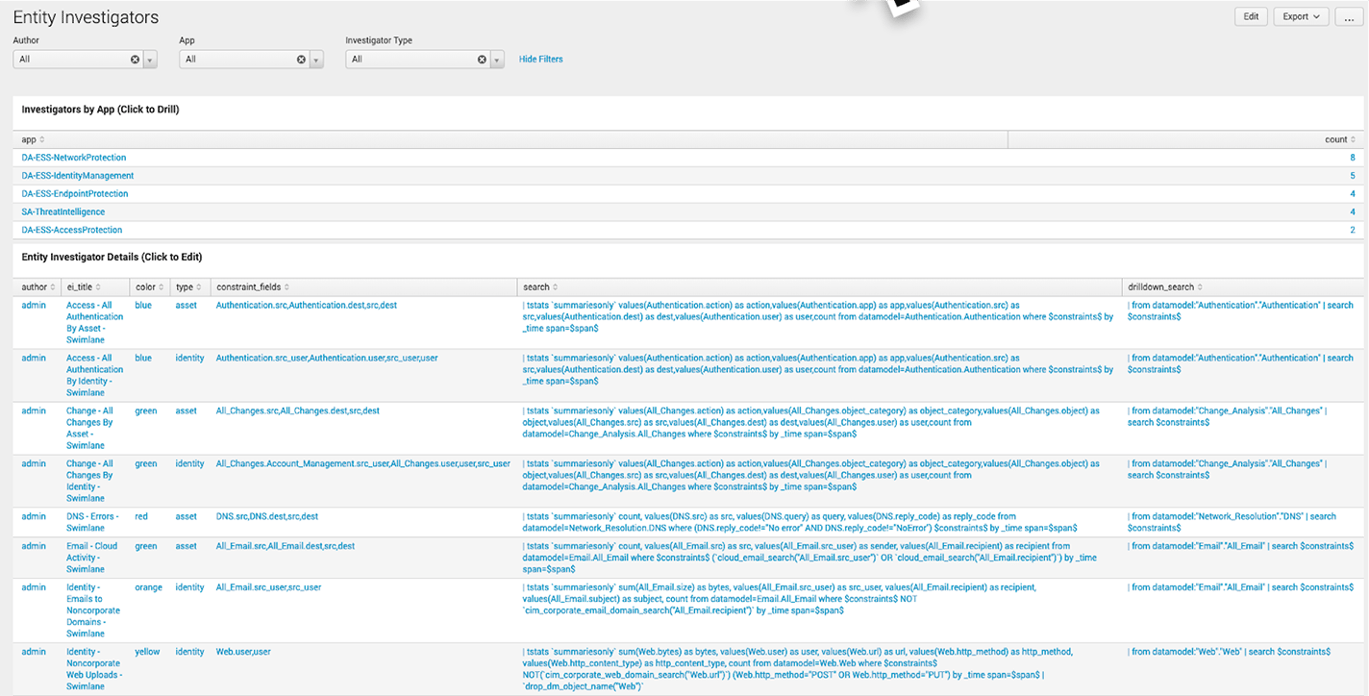
The Entity Investigator dashboard is similar:
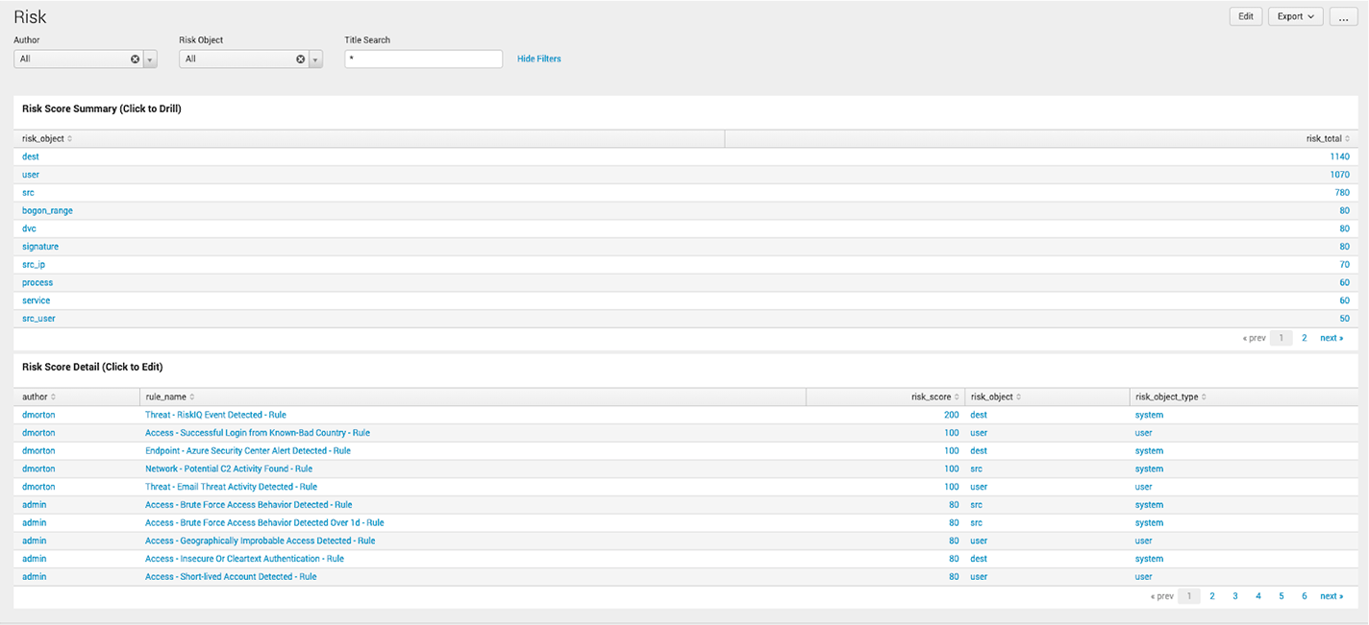
There is also a Risk dashboard that allows you to quickly analyze your risk scores – no more single-clicking through Content Manager!
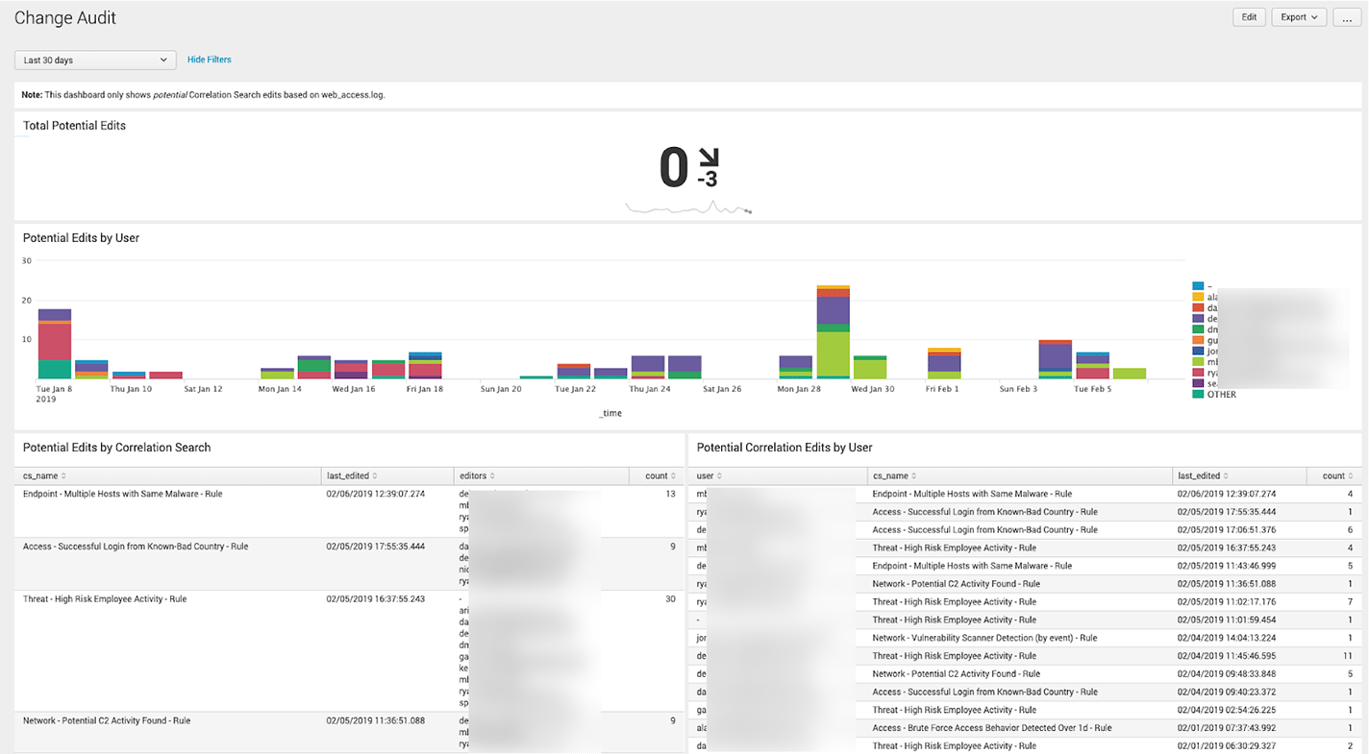
Finally, there is a Change Audit dashboard that shows who might have potentially edited a Correlation Search. At this time it’s not possible to tell if the user clicked the “Save” button – we can only tell who visited the editor page.
Under the Hood
All the dashboards are based on “| rest” calls (except for Change Audit which uses Splunk’s internal web_access.log) and leverage base/post-process searches for speed. Furthermore, it uses straight SimpleXML, so it’s also compatible with Splunk Cloud.
For example, this is the "meat" of the Correlation Search search (in fact, Splunk has documented it here)– I just had to add some additional EVAL fields:
| rest splunk_server=local /services/saved/searches
| where match('action.correlationsearch.enabled', "1|[Tt]|[Tt][Rr][Uu][Ee]|0|[Ff][Aa][Ll][Ss][Ee]")
| rename eai:acl.app as app, title as rule_name,
    action.correlationsearch.label as rule_label,
    action.notable.param.* as *
    dispatch.earliest_time as earliest
    dispatch.latest_time as latest
| eval is_rt=if(match(earliest,"rt"),"true","false")
| eval is_xtreme=if(match(search,"xswhere"),"true","false")
| eval disabled=if(disabled=1,"true","false")
The other dashboard searches are similar because they are also just saved searches.
Future
I am continuously adding and improving the App - especially when I get feedback! Look for a new release soon that adds quite a few interesting features...
Want more insight like this? Make sure to follow us on LinkedIn, Twitter and Facebook!